
Query views
A query view shows the results of a query in a grid that updates as the data changes. The grid only shows results; change data in the REPL.
Role views
Section titled “Role views”The Views sidebar has a view for each role declared in your database’s files, with a row for each member and a column for each property. A role declared inside a mod block has none, and neither has one from the standard library. Dropping a role removes its view.
Your own views
Section titled “Your own views”- Click New view, the plus button at the top of Views. The view opens with its formula ready to type.
- Type a formula, such as
Book if .pages > 450. - Choose Run or press ⌘Enter, or Ctrl+Enter on Windows and Linux.
To edit a formula again, double-click its query’s header, or press Enter or F2 on it. In a formula, Enter adds a line, and Escape stops editing.
A view’s formulas use the names of one file, which the selector beside Run shows. New views use main.saka. A database without it shows “Select Module…”, and Run stays disabled until you choose a file.
Child queries
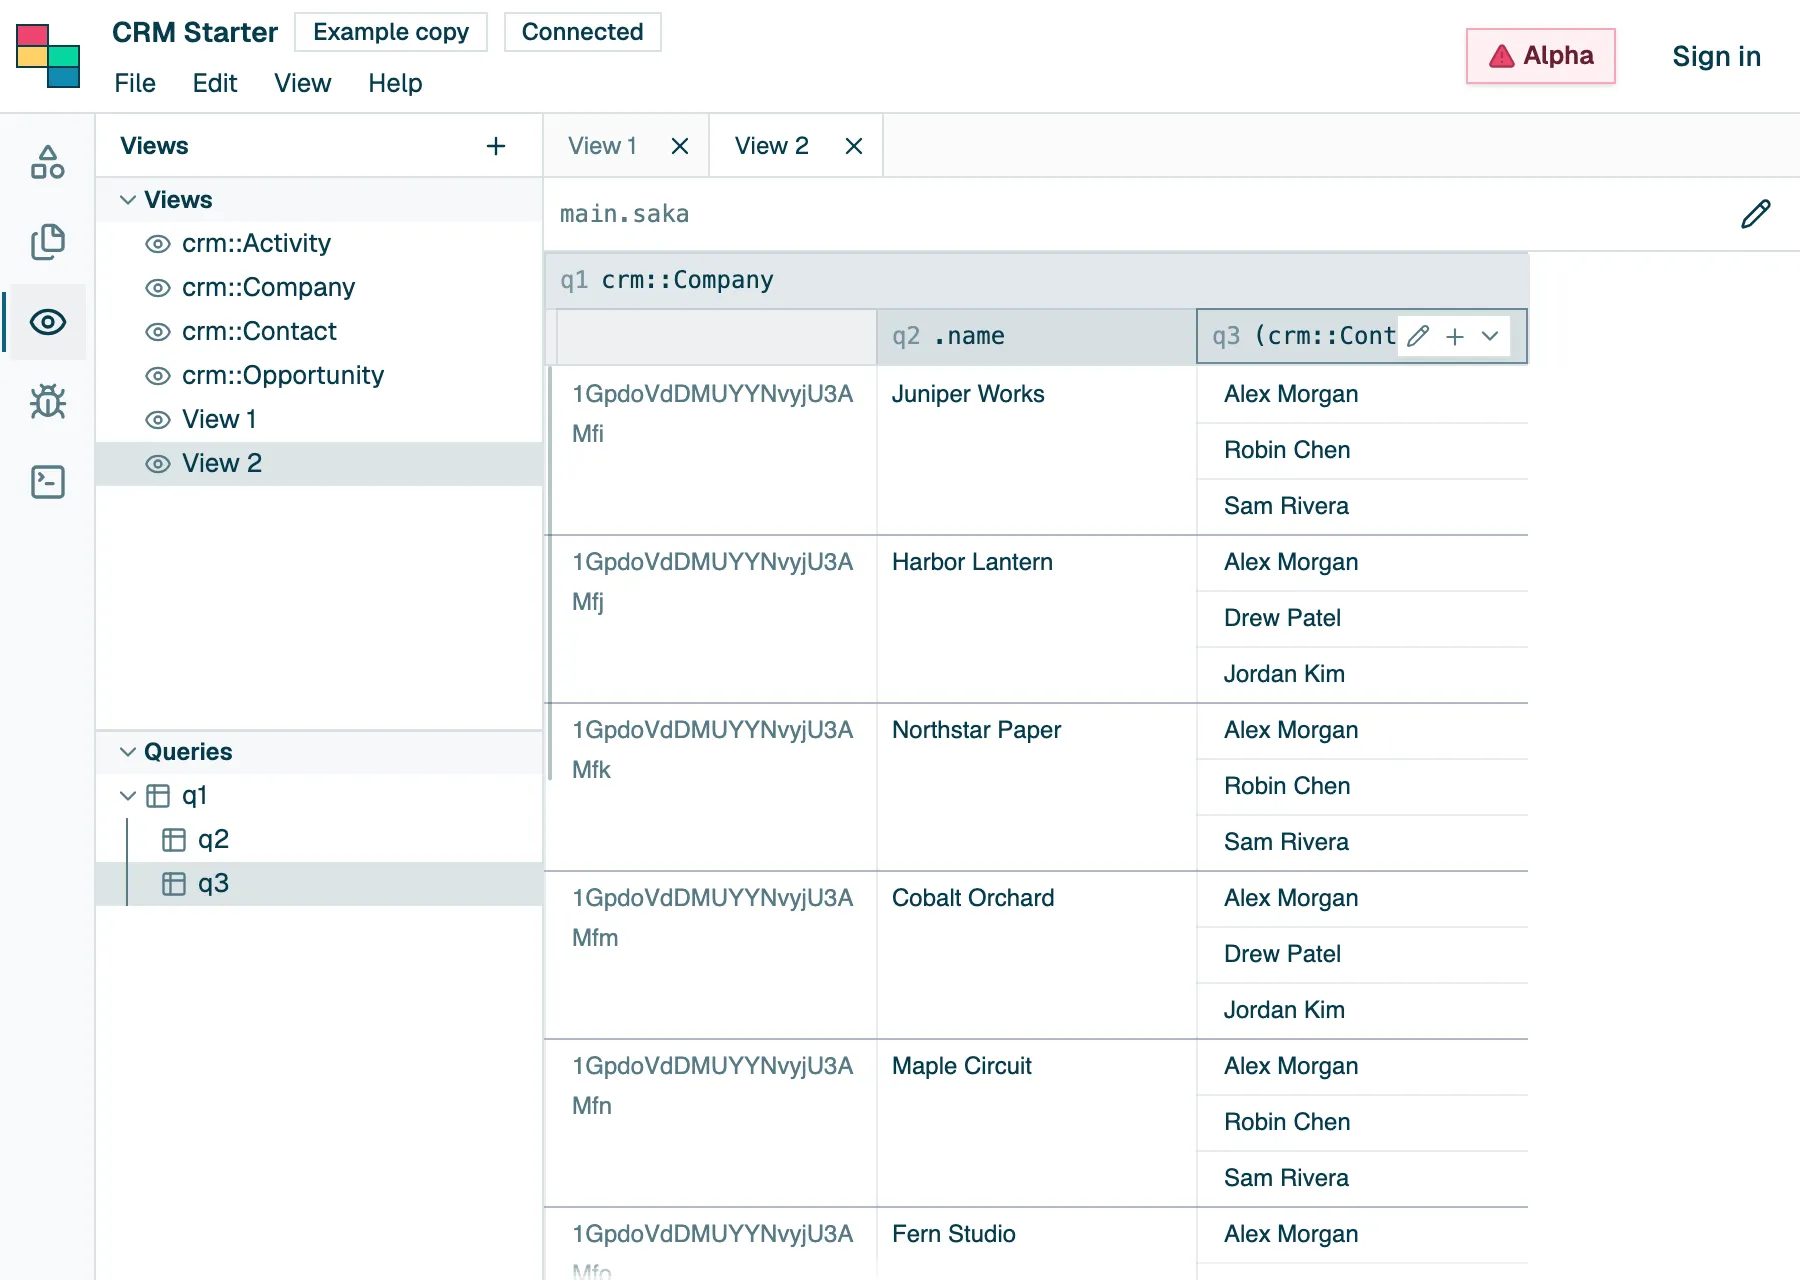
Section titled “Child queries”Choose Add child query in a query’s header menu, or on its right-click in Queries, to add a query that runs once for each row of its parent. Each query has an alias, q1 for the first. A child reads its parent’s row by the parent’s alias, and also as ., as in .name.
In the view above, the root query crm::Company has two children. .name shows each company’s name, and (crm::Contact if .company == q1).name shows the names of its contacts. Inside if, . is each contact, as in any pipeline, so the child names the company by its alias, q1.
Reading results
Section titled “Reading results”- Enter on a cell, or a double-click, shows its whole value in the Editor panel.
- ⌘C or Ctrl+C copies the selected cells as text. Copy with headers, in a cell’s menu, adds the column names.
- Sort ascending and Sort descending, in a column header’s menu, sort the rows.
Drag across cells, or hold Shift while you click or move, to select a range.
Pictures
Section titled “Pictures”A view whose results have numeric x, y, and fill fields opens as a picture: each row colors the pixel at its x and y, counted from the top left, with its fill, a color such as color::rgb(255, 128, 0) makes. Grid and Picture in the view’s toolbar switch between the two. Drag to pan, and use the wheel or the zoom buttons to zoom; Fit fits the picture to the view again.
When the database has procedures, the toolbar can run one as a clock. Step calls the chosen procedure, tick when there is one, once with a sixtieth of a second, and Play calls it 60 times a second until Pause. The picture follows every change it makes.
To try it, open Pixel Demos from Examples, query image, and choose Play. Each demo’s module has its own image and tick.
Errors and limits
Section titled “Errors and limits”A formula with an error shows the reason and keeps the previous results. A query that takes too long or builds too much data shows Limited · Retry; see Limits.
Views aren’t saved
Section titled “Views aren’t saved”Views belong to the browser tab. Reloading the page or updating Saka clears your own views; role views return.